TradingView is one of the most popular platforms for charting and analyzing markets.
If you trade futures, you might have noticed that when you search for a symbol, you can choose between Continuous Futures (Adjusted) and Non‑Continuous Futures.
At first this feature looks confusing, but once you understand it, you can use the right type of chart for your own trading plan.
Below I explain what both chart types mean, why they matter, and how to switch between them step by step.
What is a Continuous (Adjusted) Futures Chart?
A continuous futures chart combines several contract months into one single chart.
TradingView automatically rolls over from the expiring contract to the next active one.
The word adjusted means that the platform smooths out price differences between contracts.
When a new contract month starts, the price might jump because of carrying costs or market structure.
With adjustment, TradingView removes that artificial jump, so you see a clean and smooth price history.
Why use it?
- Great for technical analysis and long‑term trend studies.
- Indicators like moving averages work better without rollover gaps.
- Perfect if you want to see the overall market direction without interruptions.
What is a Non‑Continuous Futures Chart?
A non‑continuous futures chart shows the price for one single contract month only.
For example, if you open the chart for the March contract, you will see only that specific contract until it expires.
There are no adjustments or rollovers.
Why use it?
- Best for checking the real traded prices without any adjustment.
- Useful for contracts close to delivery or when you want to see the exact settlement prices.
- Helps if your strategy focuses on a specific month rather than the whole continuous history.
How to Switch Between Them in TradingView
Here’s a simple step‑by‑step guide:
- Open your futures chart in TradingView.
- Click on the symbol name in the top‑left corner.
- Type your futures symbol (for example
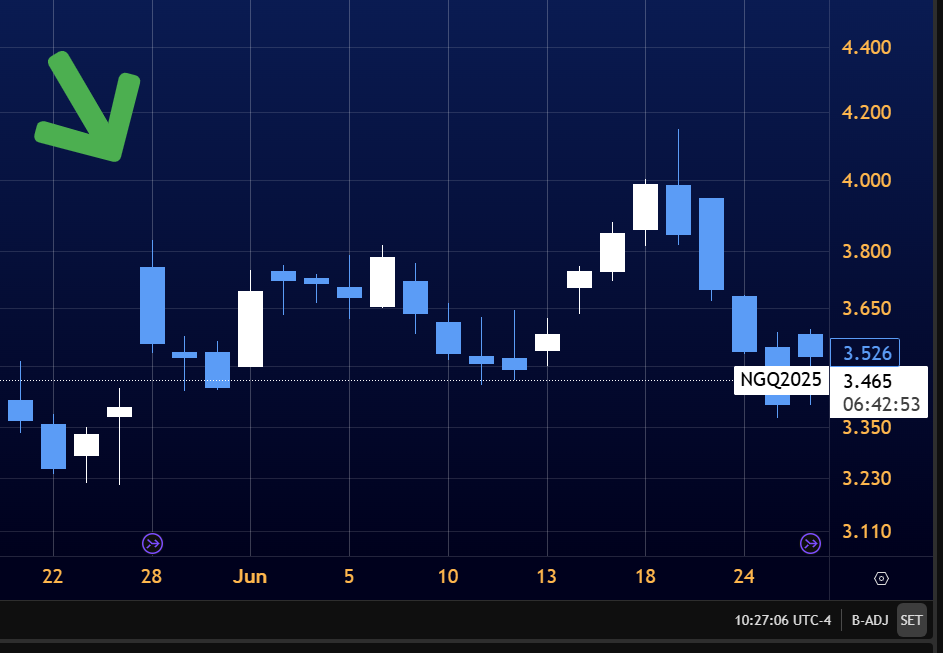
ES1!for S&P 500 futures). - Switch to B-ADJ in the bottom-right corner. The chart will update immediately.
💡 Pro Tip: You can save different layouts in TradingView if you often switch between adjusted and non‑adjusted views.
🤔 Which Chart Should You Use for Trading?
| Type | When to Use | Why |
|---|---|---|
| Continuous (Adjusted) | For chart analysis and backtesting | Smooth history, no gaps |
| Non‑Continuous | For trading a specific contract | Shows true market prices |
Final Thoughts
Switching between continuous (adjusted) and non‑continuous futures in TradingView is simple, but it can make a big difference in how you read the market.
If you want smooth charts for analysis, choose adjusted continuous futures.
If you want exact raw data, choose non‑continuous.
Try both and see which fits your strategy better.
✨ Tip: Bookmark this guide or share it with other traders who are learning how to use TradingView effectively.
Keywords to remember:
TradingView futures chart, continuous vs non‑continuous futures, adjusted futures TradingView, how to switch contracts in TradingView.