Author: nostrotrading
-
Organize Your Interactive Brokers Watchlist
I track a wide range of tickers across multiple asset classes on Interactive Brokers’ Trading Workstation (TWS). My watchlists include bonds, volatility products, stocks, commodities, and many other instruments. When all of these assets are dumped into a single list, it becomes chaotic and hard to read. There’s too much information in one place, and…
-
How to Switch Between Continuous (Adjusted) and Non‑Continuous Futures in TradingView
TradingView is one of the most popular platforms for charting and analyzing markets.If you trade futures, you might have noticed that when you search for a symbol, you can choose between Continuous Futures (Adjusted) and Non‑Continuous Futures. At first this feature looks confusing, but once you understand it, you can use the right type of…
-
Zweig Breadth Thrust Indicator – Why It’s Not Always Right
The Zweig Breadth Thrust (ZBT) is a famous trading indicator. It was created by Marty Zweig to spot the start of new bull markets. The idea is simple: if lots of stocks move from “oversold” to “overbought” in a short time (less than 10 trading days), it could mean strong buying is happening. A classic…
-
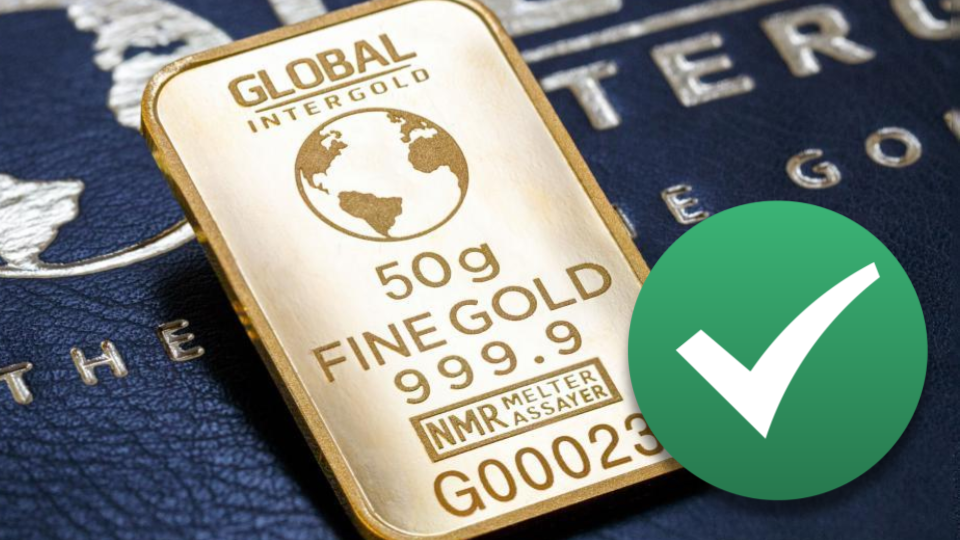
💰 How to Invest in Gold: 5 Popular Ways Explained Simply
Gold has been trusted for centuries as a way to protect money during uncertain times. But today, there’s more than one way to invest in gold – and each method has its pros and cons. In this article, we’ll go over 5 common options so you can find the right one for your trading style…
-
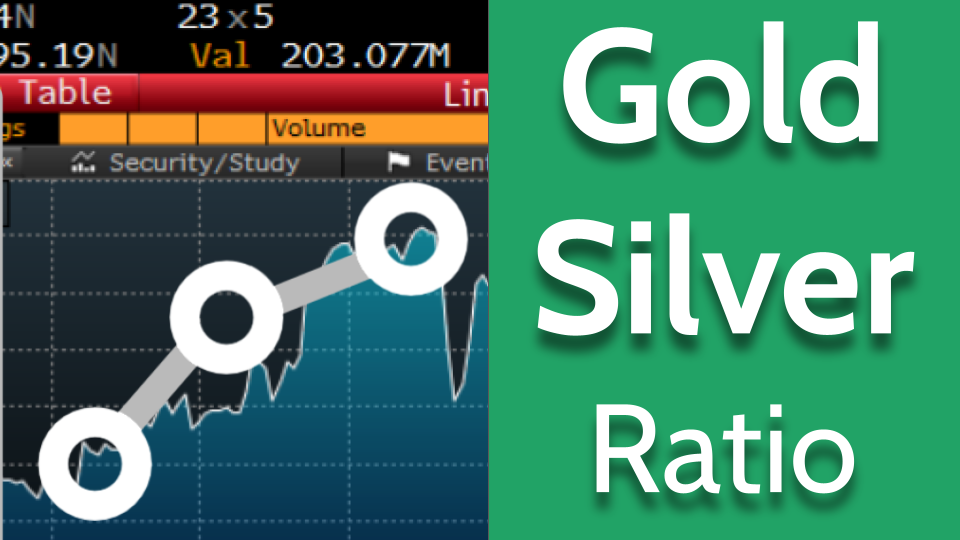
Gold/Silver Ratio in Google Sheets with Live Futures Data
Want to calculate the Gold/Silver ratio in Google Sheets using live Futures data? 📊✨ In this guide, I’ll show you how to make your ratio calculation more robust and dynamic by pulling real-time price data from the web! 1. Fetch Live Gold and Silver Prices Google Sheets provides the IMPORTXML function, which allows us to…
-
How to Use Google Sheets to Track Gold Price Automatically (IMPORTXML)
If you’re looking to track the gold price in real-time using Google Sheets, you can easily do this by pulling the data from a website using the IMPORTXML function. In this blog post, I’ll show you how to get the price of gold using the continuous future contract from Google Finance, specifically from this URL:…
-
Building a VIX Term Structure in Google Sheets
Volatility indices provide a crucial insight into market expectations of future volatility. The VIX term structure, which includes multiple time horizons of volatility expectations, is particularly useful for traders and investors looking to analyze market sentiment. In this guide, we will walk through how to build a VIX term structure in Google Sheets using the…
-
How to Calculate Year-to-Date (YTD) Performance in Google Sheets
If you’re tracking the performance of stocks or ETFs in Google Sheets, calculating Year-to-Date (YTD) performance can give you a clear picture of how your investments are performing. Instead of manually calculating the change in price, you can use a custom formula that automates this process, using data from Google Finance. In this guide, we’ll…
-
VIX Futures Prices in Google Sheets
How to Scrape VIX Futures Prices and Import Them into Google Sheets In today’s fast-paced world, tracking market data in real-time is essential for making informed investment decisions. The VIX futures index, often referred to as the “fear gauge,” is a crucial indicator of market volatility, and staying updated with its movements can help you…