Volatility indices provide a crucial insight into market expectations of future volatility. The VIX term structure, which includes multiple time horizons of volatility expectations, is particularly useful for traders and investors looking to analyze market sentiment. In this guide, we will walk through how to build a VIX term structure in Google Sheets using the following volatility indices:
- VIX1D (1-day volatility index)
- VIX9D (9-day volatility index)
- VIX (30-day volatility index, often referred to as the “Fear Index”)
- VIX3M (3-month volatility index)
- VIX6M (6-month volatility index)
- VIX1Y (1-year volatility index)
Additionally, we will track today’s and yesterday’s prices, as well as the percentage change for each.
You can also watch in on YouTube
Step 1: Setting Up Your Google Sheet
- Open a new Google Sheets document.
- Create column headers for:
DateVIX1DVIX9DVIXVIX3MVIX6MVIX1YYesterday’s PriceChange (%)
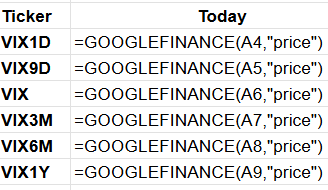
Step 2: Importing VIX Data Using GOOGLEFINANCE
Google Sheets provides a built-in GOOGLEFINANCE function to fetch financial data. GOOGLEFINANCE does support VIX directly.
Step 3: Tracking Changes in VIX Values
To fetch yesterday’s price, use the following formula:
=INDEX(GOOGLEFINANCE(A4,"price",TODAY()-2,TODAY(),"DAILY"),2,2)To calculate the percentage change from the previous day:
=(B2 - B3) / B3 * 100Repeat this formula for each volatility index.
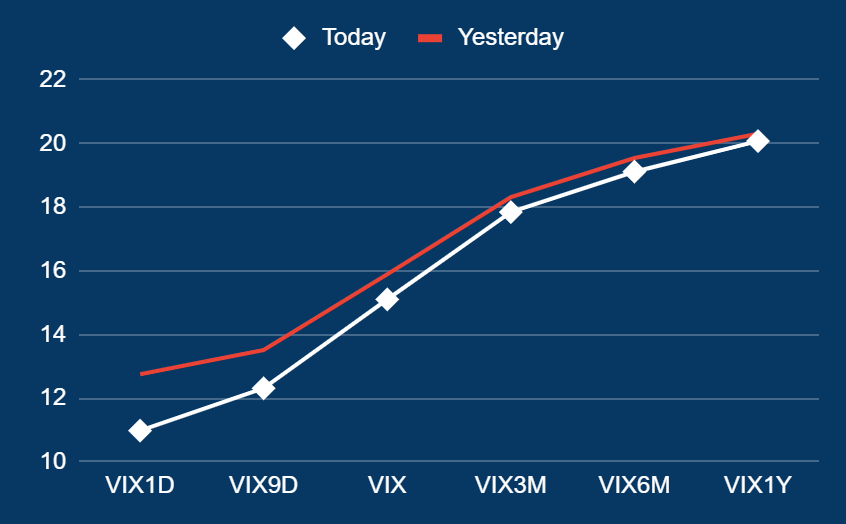
Step 4: Visualizing the Term Structure
Google Sheets allows for easy visualization of data using charts:
- Select the columns containing VIX indices.
- Click Insert > Chart.
- Choose a Line Chart to represent how volatility changes over different time horizons.
- Customize the axes and labels for clarity.
Conclusion
By leveraging Google Sheets and GOOGLEFINANCE, you can track VIX data efficiently. While direct support for VIX term structure is limited, supplementing with external sources or manual updates ensures a comprehensive overview of market volatility.
With automation and proper visualization, tracking market volatility has never been easier!